Overview
nmtvis is a visualization toolkit for NMT(Neural Machine Translation) model.
It aims at helping researchers better understand how their model works so that they can further adjust or improve the model.
Installation
Use pip to install nmtvis:
pip install nmtvis
Requirements
- Python3
- Numpy
- Sklearn
Features
- Visualize attention weights in attention-based NMT models.
- Visualize high-dimensional word embeddings in 3D or 2D ways.
- Visualize beam search decoding process.
Links
- Source Code: https://github.com/player-eric/NMT-Visualizer
- Documentation: https://nmtvis.readthedocs.io/en/latest
- For example code and data, please refer to: https://github.com/player-eric/NMT-Visualizer/tree/master/example
License
The project is licensed under the MIT license.
Support
If you are having issues, please let me know. Contact me at digimonyan@gmail.com
Attention Visualization
Module nmtvis.AttentionVisualizer provides two methods to visualize the attention weights in attention-based NMT models.
One method, visualize_attention(), aims at visualizing attention between target sentence and source sentence in translation. And the other method visualize_transformer_attention() is targeted at visualizing attention weights in Transformer-based models.
By processing the attention weights into specified format and calling the corresponding method, a temporary web server rendering the visualization result will be lauched.
See this demo with example data: https://player-eric.github.io/attention_demo/
Detailed introduction to this module and its potentioal usage can be view at: https://player-eric.github.io/2020/02/20/nmtvis-attention/
Visualization Views
- Optionally, the attention weights can be visualized in three views:
Alignment graph view, Heatmap view, and Highlighted-words view.
In the alignment view, the source sentence and target sentence are displayed parallelly. Pairs of words from the sentences are connected by lines, with stroke width proportional to the corresponding attention weight.
Alignment View
In the heatmap view, attention weights are ploted as a partitioned matrix. Blocks within the matrix are of different color, indicating the extent of attention.
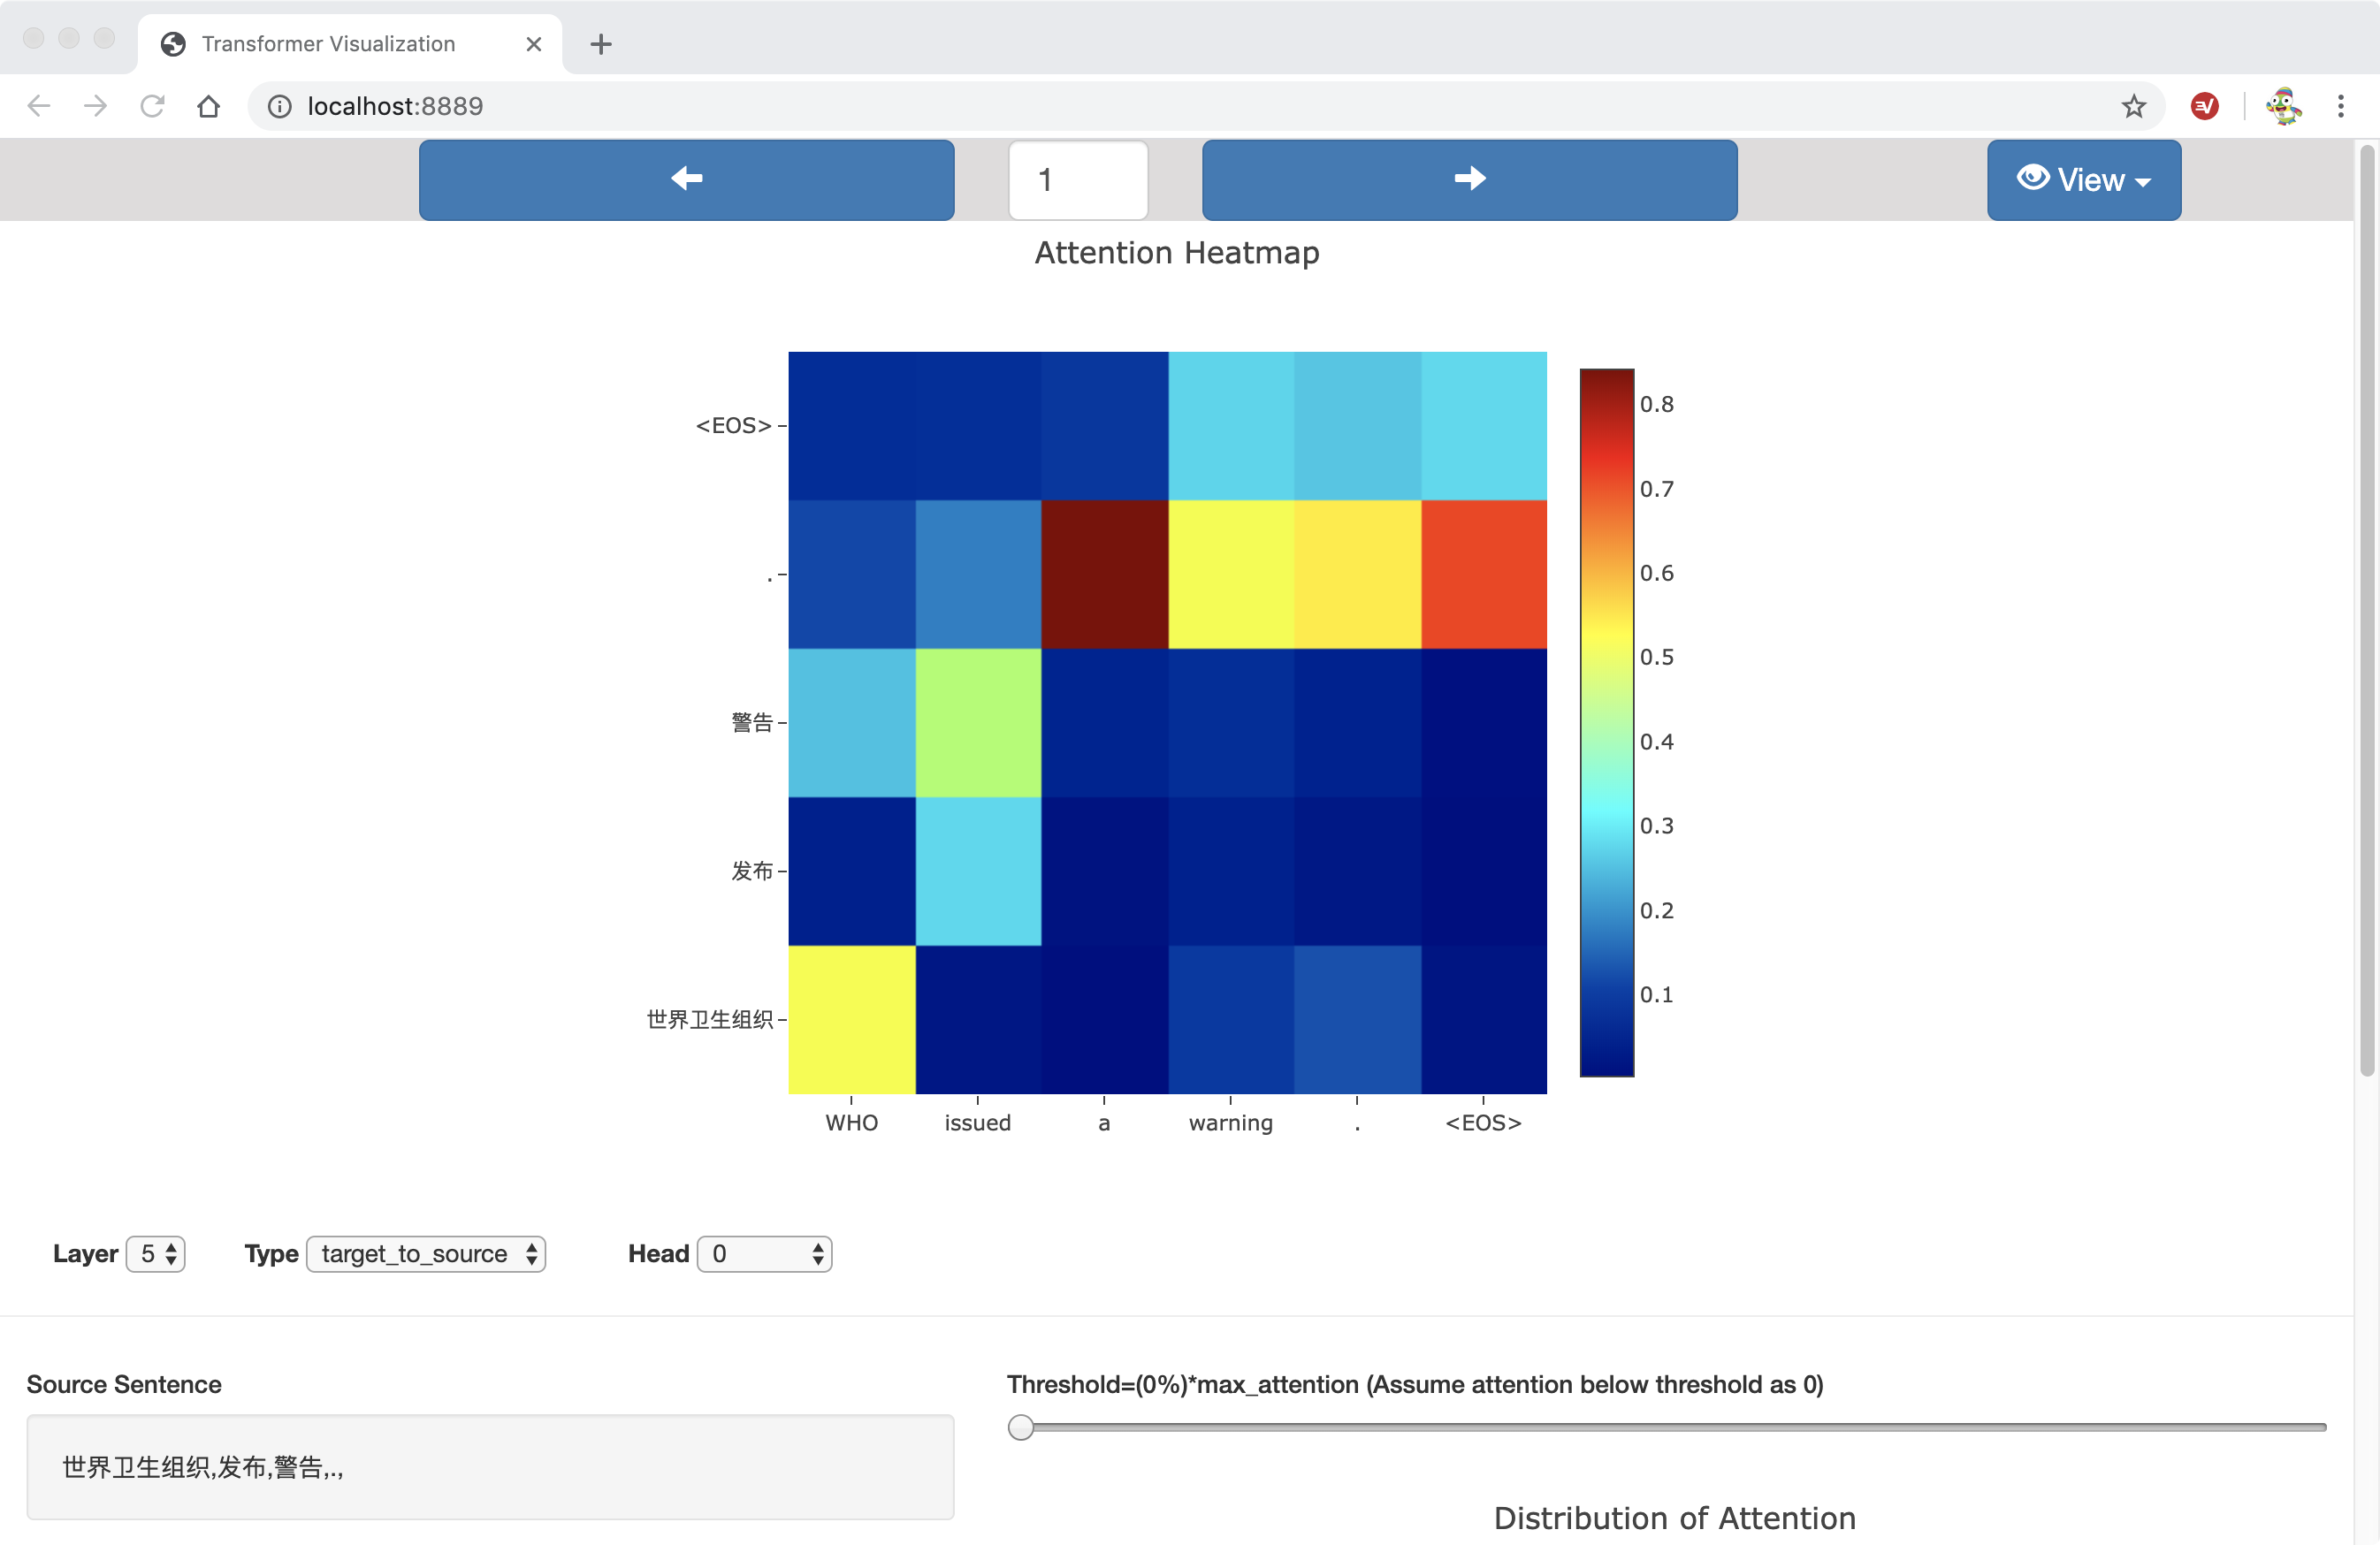
Heatmap View
In the highlighted-words view, a word is selected when the mouse pointer hovers over it. Then all the words(including the selected one) are highlighted according to the attention strength.
Heatmap View
nmtvis.AttentionVisualizer.visualize_attention(data:List[dict])
| Parameter | Detail |
|---|---|
| data | Parameter ‘data’ is a list of dictionaries. The length of this list corresponds to number of sentence pairs. Each dictionary should contain the following keys and value:
|
nmtvis.AttentionVisualizer.visualize_transformer_attention(**kwargs)
- visualize_transformer_attention() takes three keyword parameters:
- encoder_self_attention
- decoder_self_attention
- decoder_encoder_attention
Seperately these three parameters are lists of dictionaries, with lengths equal to the number of sentence pairs. Note that at least one type of attention weights should be passed in.
| Parameter | Detail |
|---|---|
| encoder_self_attention | Each dictionary in ‘encoder_self_attention’ should contain these keys and value:
|
| decoder_self_attention | Each dictionary in ‘decoder_self_attention’ should contain these keys and value:
|
| decoder_encoder_attention | Each dictionary in ‘decoder_encoder_attention’ should contain these keys and value:
|
Embedding Visualization
Module nmtvis.EmbeddingVisualizer is designed for visualizing word embeddings(or other high-dimensional vectors like encoded sentence). After preparing the words and corresponding embedding vectors, the user can simply pass them into the method visualize_embedding_pca() or visualize_embedding_tsne() and get the visualization result rendered in web. The basic workflow of the methods is to first conduct dimensionality reduction(PCA or TSNE), which transforms the originial vector to a 2-D or 3-D vector, and then start a local server for web visualization.
Word Embedding Visualization
See this demo with example data: https://player-eric.github.io/embedding_demo/
nmtvis.EmbeddingVisualizer.visualize_embedding_pca(**kwargs)
| Parameter | Detail |
|---|---|
| embeddings | A python list of embedding vectors for words |
| vocab | A python list of words, its order corresponds to the order of embedding vectors |
| n_dim | The expected number of dimensions to visualize |
| n_neighbor | Number of nearest neighbors to record(will be shown in the visualizaion) |
copy whiten svd_solver totol iterated_power random_state |
Configuration for the PCA process as detailed in sklearn’s documentary https://scikit-learn.org/stable/modules/generated/sklearn.decomposition.PCA.html For a quick start, the default values would suffice |
nmtvis.EmbeddingVisualizer.visualize_embedding_tsne(**kwargs)
| Parameter | Detail |
|---|---|
| embeddings | A python list of embedding vectors for words |
| vocab | A python list of words, its order corresponds to the order of embedding vectors |
| n_dim | The expected number of dimensions to visualize |
| n_neighbor | number of nearest neighbors to record(will be shown in the visualizaion) |
perplexity early_exaggeration learning_rate n_iter min_grad_norm metric init verbose random_state method angle n_jobs |
configuration for the TSNE process as detailed in sklearn’s documentary https://scikit-learn.org/stable/modules/generated/sklearn.manifold.TSNE.html For a quick start, the default values would suffice |
Beam Search Decoding Visualization
Module nmtvis.BeamSearchVisualizer targets at visualizing the beam search decoding process by drawing the search tree.
By saving the beam search decoder’s state at every step and then calling the visualize_beam_search_decode method, the user can get an interactive search tree graph rendered in a Web.
Beam Search Decoding Visualization
A demo with example data: https://player-eric.github.io/beam_demo/
nmtvis.BeamSearchVisualizer.visualize_visualize_beam_search_decode(**kwargs)
| Parameter | Detail |
|---|---|
| source_sentences | A python list consisting translated sentences |
| target_sentences | A python list consisting translation results |
| predicts | An numpy array of shape [num_sentences,num_steps,beam_width] Words predicted by the beam search decoder at every step |
| parents | An numpy array of shape [num_sentences,num_steps,beam_width] Indexes of beams which the predictions at next step come from |
| log_probs | An numpy array of shape [num_sentences,num_steps,beam_width] Log probabilities of giving every predicted words |
| beam_width | A python int The size of the beams |
As the above parameters may be a little bit complicated, here is a simple example:
Source sentence: 我 爱 你
Target sentence: I love you
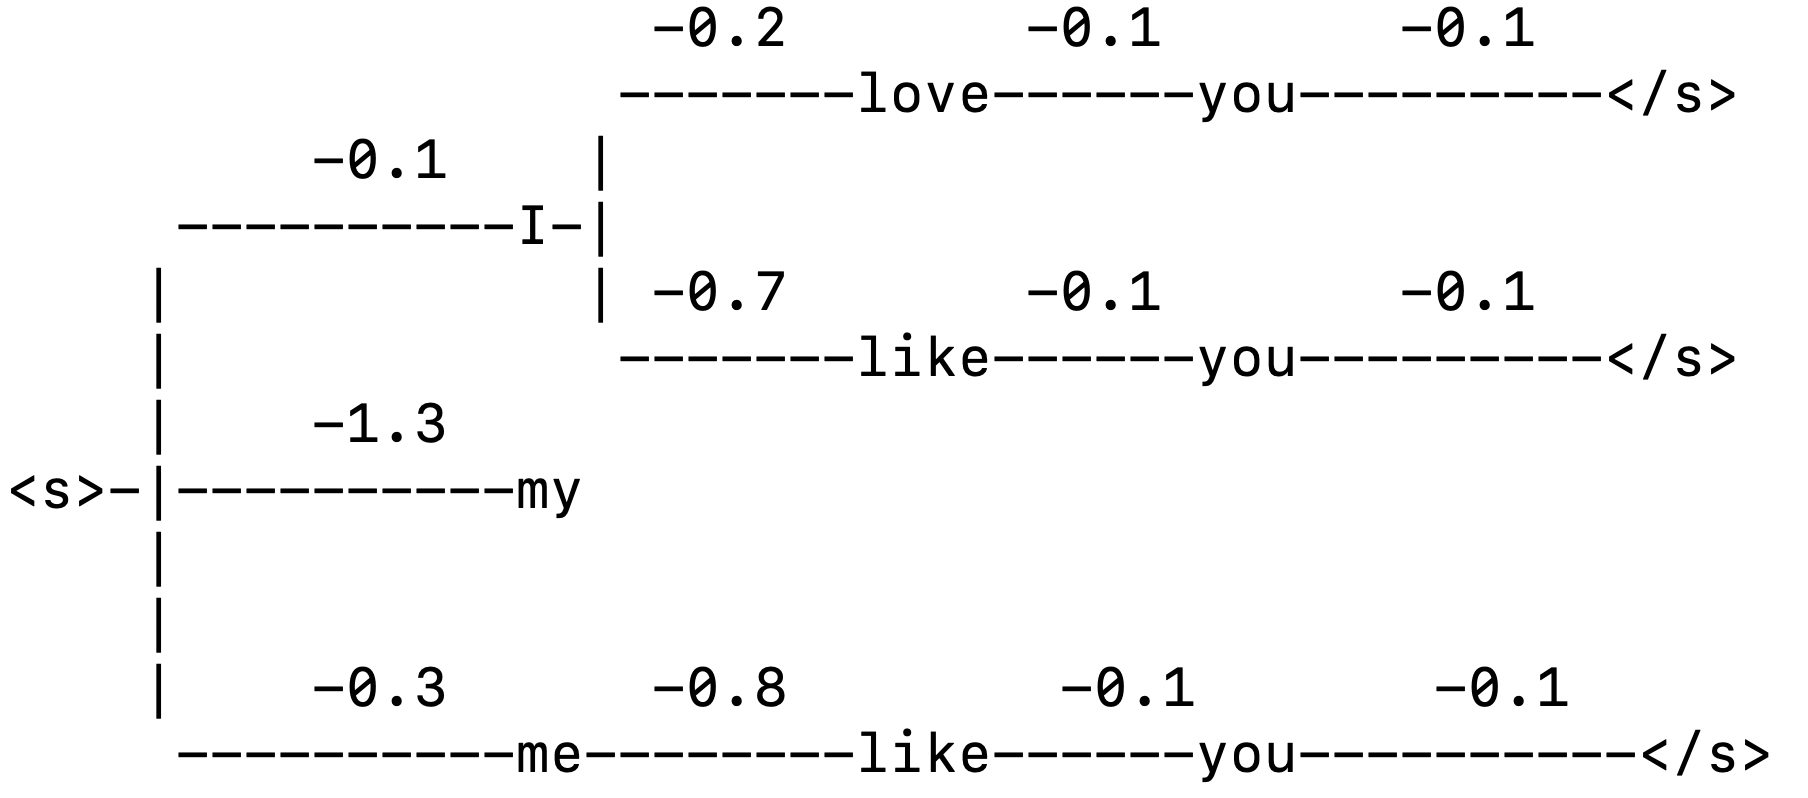
To visualize the above decoding process, parameters passed in should be:
source_sentence:[“我爱你”]
target_sentence:[“I love you”]
- predicts:
- [
- [
[“I”,”my”,”me”],
[“love”,”like”,”like”],
[“you”,”you”,”you”],
[“</s>”,”</s>”,”</s>”]
]
]
- parents:
- [
- [
[0,0,0],
[0,0,2],
[0,1,2],
[0,1,2]
]
]
- log_probs:
- [
- [
[-0.1,-1.3,-0.3],
[-0.2,-0.7,-0.8],
[-0.1,-0.1,-0.1],
[-0.1,-0.1,-0.1]
]
]
beam_width:3